Introduction
During my 2019 master’s semester abroad at Umeå University (UmU) in northern Sweden, I visited several physics coursed. Amongst them was the “Advanced Project in Physics”. The course offered the opportunity to work independently on a physics project over several months, under the guidance of an experienced researcher. It gave insight in how the work life of a researcher could be. Therefore I was intrigued to start my project. Specifically, I engaged in a a project that applied concepts from physics to data from labor markets in Sweden. During this semester, my project supervisor Ludvig Lizana and I collaborated with the professor of economic geography at UmU, Rikard Eriksson, who presented us with a considerable dataset on the Swedish labor market. After I left Umeå in 2019, I continued working on this topic in 2021 and 2022 during my PhD at TU Ilmenau and had the privilege of visiting Umeå twice more. Even though my main focus during that time was on fluid dynamics, this project remained close to my heart. In this post, I would like to share the insights from this project.
You might have heard of the Swedish principle of public access to official records (offentlighetsprincipen). It ensures that citizens have the right to access most government documents and records, promoting transparency and accountability in public administration. This principle is closely tied to the collection of large amounts of data, as it allows individuals and organizations to request access to a wide range of public records. As a result, Sweden offers a data-rich environment that supports transparency, informed decision-making, and public trust. For data scientists, this translates into large, structured datasets that are ripe for analysis.
In our case, the dataset comprised anonymized individuals along with their characteristics, such as sex, place of birth, region of employment, salary, and the industrial sector in which they work. Intrigued by its potential, we quickly decided to analyze the data and search for patterns. With Rikard’s guidance, we framed the project around regional diversity, exploring the composition of the Swedish labor market and its potential influences on innovation.
Now, I’d like to share the results of this analysis, the insights we gained, and the broader questions about diversity and innovation that remain open for discussion. Keep in mind that these results haven’t been peer-reviewed—they’re simply the outcome of my data analysis, along with some initial thoughts on how the findings might be interpreted.
Regional Diversity in the Swedish Labor Market
Let’s start with an overview of key population figures for Sweden: As of 2021, Sweden has a population of approximately 10,452,326 citizens [1]. Its largest cities are Stockholm (978,770 inhabitants in the municipality of Stockholm [2]), Gothenburg (587,549 in the municipality of Göteborg [3]), and Malmö (351,749 in the municipality of Malmö [3]). Together, these three cities account for over 18% of the country’s total population. Beyond these major hubs, Sweden is also home to several other urban centers with populations exceeding 100,000 residents. Let us keep these facts in mind when interpreting the results of the following analysis.
Data Analysis of the Swedish Labor Market
The dataset we received was structured similarly to the one shown in Table 1. It contained records spanning the years 1960 to 2015, with data collected in five-year intervals. Each individual was identified through an anonymous ID, and the dataset included information on their sex, salary, municipality of birth, and current municipality of employment. Additionally, an individual’s line of work could be categorized using the Swedish Standard Industrial Classification (Svensk näringsgrensindelning, SNI).
| Year | Anonymized ID | Sex | Work Region | Birth Region | Industry | Annual Salary [SEK] |
| 2015 | 1687829252 | Female | Stockholm | Stockholm | Service | 621150 |
| 2010 | 7657824511 | Female | Stockholm | Uppsala | Manufacturing | 498500 |
| 1995 | 1788511252 | Male | Kiruna | Kiruna | Mining | 302746 |
| 1990 | 8552344212 | Female | Umeå | Kiruna | Energy | 611243 |
| 2000 | 5234525234 | Male | Umeå | Skellefteå | Construction | 542307 |
| 2005 | 4698429574 | Female | Linköping | Karlstad | Insurance | 721854 |
| ⋮ | ⋮ | ⋮ | ⋮ | ⋮ | ⋮ | ⋮ |
Tab.1 - Example of the raw labor market dataset that was analysed at UmU. The dataset consisted of millions of individuals for the time period 1960 - 2015, in five-year intervals.
In our anaylsis of the dataset, all labor market municipalities (kommuner) were grouped into one of the 70 main regions of Sweden (listed at the bottom of this post). We classified individuals by birth region into Swedish-born and foreign-born. Swedish-born individuals were assigned to the same 70 regions as described above, while foreign-born individuals were grouped by their geographical origin (listed at the botom of this post) into seven additional birth regions.
A first analysis of the data can be seen in figure 1a). It displays a map of Sweden’s 70 labor regions, illustrating the relative difference between the number of workers currently employed in each region and the number of workers that were born there but might now work anywhere in Sweden. It can be seen that there is quiet a mobility of work force. Northern Swedes tend to leave their birth regions, while urban centers like Stockholm, Malmö, and Gothenburg attract workers from across Sweden and beyond (not shown). This might be explained by the demand for labor in the larger cities or better career prospects and thus higher salary. However, exceptions like Umeå and Luleå/Boden also show an increase, likely due to their universities, where graduates often remain for employment after completing their studies. The reasons behind individuals’ work-related migration are not the subject of this post and were not analyzed. This would require additional data, such as surveys on their motivations. Nevertheless, figure 1a) indicates that Sweden’s labor markets are not homogeneous in terms of worker origins; rather, they are composed of individuals from various parts of the country, as well as from abroad.
At the outset of our study, we focused on quantifying the composition of Sweden’s labor markets and their changes over time. This raises several key questions: How can we measure the diversity of a labor market? Which labor markets are the most diverse in terms of workers’ birthplaces? Is Stockholm, by far the largest labor market in Sweden, also the most diverse? Which regions have seen the most significant diversification of their workforce over the last 60 years? These are the questions we will explore in the following sections. Unless otherwise specified, ‘diversity’ will from now on refer to the birthplace of workers.
Fig.1 - 2015 Swedish labor market mobility: a) map of Sweden’s 70 labor regions, showing the relative difference between the number of locally born and currently employed workers.
b) 2015 Composition of two labor markets based on the birth regions of their workers. It can be seen that there are regional differences in workforce origins for both labor markets.
Labor Market Diversity in Terms of Birth Place
In our description of the labor market, we draw inspiration from the field of statistical physics, where entropy is used to measure disorder or uncertainty within a system. This concept, which reflects how evenly (or unevenly) a system’s components are distributed across possible states, serves as a useful measure for understanding the complexity of a labor market. Building on this idea, we apply the Shannon entropy from information theory to assess the composition of the labor market. By examining the distribution of the workers birthplace, we can quantify the market’s diversity and explore how it changes over time.
For this, we define the probability of finding a person from their birth region \(i\) in a labor market as the relative frequency \(p_i\) of individuals from that region among all workers in that labor market
\[\begin{align} p_i &= \frac{N_i}{\sum\limits_j^{n_{\rm birth}} N_j}. \end{align}\]Here \(N_i\) is the number of individuals that were born in region \(i\) working in the labor market of interest. Further, \(n_{\rm birth}=77\) represents the number of distinct birthplaces (see last section). Note that all \(p_i\) sum to unity
\[\begin{align} \sum\limits_i^{n_{\rm birth}} p_i = 1. \end{align}\]It is these frquencies \(p_i\) that are shown in figure 1b) for the two labor markets Kiruna/Gällivare and Stockholm/Södertäilje. It can be seen that their composition is quiet different. In Stockholm, less than 45% of the workforce comes from the local population, while in Kiruna, nearly 75% of the labor market is made up of individuals born there. Stockholm, with its global appeal, attracts a significant number of non-Swedish workers, whereas Kiruna, located in the far north, primarily draws labor from nearby regions such as Luleå and Haparanda. Let us now try to quantify this composition via a Shannon entropy:
Based on the definition of \(p_i\) one can define the entropy \(H\) of a labor market as
\[\begin{align} H &= -\sum\limits_i^{n_{\rm birth}} p_i \log_{10}{p_i}, \end{align}\]where \(\log_{10}(0) = 0\). Note that this defintion of diversity is agnostic of the specific origin of the worker and only quantifies the overall homogenity of the labor market’s workforce based on birthplace. Further, in information theory, the logarithm base \(\log_2\) is commonly used, but in this case, we will use base 10 since we are working with population numbers. With this definition it can be seen that the minimum entropy of \(0\) is reached for when all workers are concentrated from one birth region \(i\), while its maximum value \(\log_{10}(n_{\rm birth})\) is achieved when workers are evenly selected from all birth regions, i.e. their distribution is uniform.
Entropy is a common tool to measure a labor market’s diversity in terms of several aspects. The authors in [4] for example defined diversities for demography, culture and education all based on the entropy approach. With this they found that the rate of new firm formation correlates well with the aforementioned measures. In [5], various diversity measures, including the entropy-based approach, are compared in the context of racial and ethnic diversity.
Using the information from figure 1b) and our diversity measure, we can deduce that Stockholm’s labor market should have a higher entropy value compared to Kiruna’s. And in fact we get \(H_{\rm Stockholm/Södertälje} = 0.63\) and \(H_{\rm Kiruna/Gällivare} = 0.37\)! However, these entropy values still lack a practical interpretation. In the context of biodiversity and species, a more useful measure derived from entropy is the Hill number. While there is a familify of Hill number definitions, we will make use of the following
\[\begin{align} D &= 10^H, \end{align}\]i.e., the exponential of the entropy. Here the minimum value, representing a non-diverse labor market, is equal to \(D=1\) and a perfectly diverse labor market is \(D=n_{\rm birth} = 77\)). In this way, the diversity is quantified by the effective number of worker origins in the work force. Obviously, a labor market with \(D=n_{\rm birth}\) is unlikely to exist in practice, as any city will typically have a majority of native workers and an unbalanced migration stream. Let’s get back to our example from figure 1b). The entropy values above then translate into the following Hill numbers \(D_{\rm Stockholm/Södertälje} = 15.27\) and \(D_{\rm Kiruna/Gällivare} = 4.97\). Therefore, in 2015, Stockholm’s workforce was effectively composed of workers from 15 regions, while Kiruna’s workforce was effectively drawn from only 5 regions. Let us now dive into the results of our analysis using the above mentioned diversity measure.
Figure 2a) displays a map of Sweden’s labor markets in 2015, with the corresponding Hill numbers represented by color. It can be seen that the south of Sweden exhibits much larger Hill numbers than the north. However, despite its size, Stockholm’s labor market (\(D_{\rm Stockholm/Södertälje}=15.27\)) does not have the highest diversity value. Uppsala (\(D_{\rm Uppsala}=18.09\)), Linköping (\(D_{\rm Linköping}=16.78\)) and Enköping (\(D_{\rm Enköping}=15.32\)) outperform the captial. Umeå lies with \(D_{\rm Umeå}=11.72\) still above the meadian labor market’s Hill number of \(\tilde{D}=10.10\). The most homogeneous composition show Kiruna (\(D_{\rm Kiruna/Gällivare}=4.97\)) and Skellefteå (\(D_{\rm Skellefteå}=5.45\)), which exhibit the lowest Hill numbers.
However, this has not always been the case. Figure 2b) shows the ranking according to Hill numbers for each year from 1960 to 2015. It can be seen that there was quiet a lot of movement in the Swedish labor markets. Karlskoga, Avesta/Hedemora, starting out at the highest places in 1960, decreased in diversity significantly, while climbers like Umea and Växjö have shown that over the course of over 50 years the labor market can diversify significantly.

Fig.2 - Labor Market Diversity: a): Hill number of the labor markets in 2015. The maximum value is \(D_{\rm max}=77\), corresponding to full parity of worker origins.
b): Hill numbers of all labor markets ranked from lowest (bottom) to highest (top) value in each year. There is significant movement in the diversity measure.
Climbers, with initially low Hill numbers, reach larger ranks, while descenders, with initially high Hill numbers, fall to lower ranks.
While figure 2b) only showed the rank of diversity, i.e. the labor markets ordered by their Hill number, it does not allow for a comparison of diversity between the subsequent years. For this figure 5 can be consulted. It properly scales the data for each year by the min-max Hill number range in that year. Here it can be seen that there is a converging trend over the years. Over the decades initially homogenous regions diversified their work force, hence increasing their Hill number, while initially heterogeneous labor markets starting with large Hill numbers lost in diversity. On average the Swedish labor markets slightly increased their workforce diversity.
Fig.3 - Scaled Hill numbers of all labor markets ranked from lowest (bottom) to highest (top) value in each year:
The y-axis for each year is scaled by the min-max Hill number range for that year, allowing for comparisons across different years.
It can be seen that the diversity measure follows a converging trend, where initially high Hill number values decreased, while initially low values increased.
See also figure 4.
Figure 4 underlines the findings from figure 3, as the average Hill number of Sweden’s regions slightly increases, and the min-max range of the diversity measure over the 70 labor market regions becomes slimmer. This trend began in the 1970s and appears to have converged since the late 1990s, with the diversity in the labor markets stabilizing within a narrower range. Additionally, the graphic provides insight into the time scales over which diversity changes. In the least diverse region (bottom dashed line), the number of effective worker birthplaces nearly doubled from 1960 (\(D=2.53\)) to 2015 (\(D=4.97\)), a span of over 50 years. In contrast, the annually most diverse region (upper dashed line) saw a 29% decrease in its diversity, dropping from its highest value in 1965 (\(D=25.32\)) to its lowest in 1995 (\(D=17.99\)) within just 30 years.
Fig.4 - Average Swedish Labor Market Hill number:
The lower and upper dashed lines indicate the min and max Hill number values.
While diversity is increasing in total, the variance over all regions is decreasing. See also figure 3b).
Having examined the data on labor market diversity, we now turn to the second dataset provided to us: a regional-level databank containing information on novel product innovations. Building on the previous analysis, we might ask ourselves whether we can draw a relationship between the labor market diversity measure defined above and innovations within the labor market.
Does Labor Market Diversity Drive Innovation?
The SWINNO database [6] documents Swedish product innovations from 1970 onward, defining a product innovation as any innovation that is commercially available on the market. This contrasts with process innovations, which are retained for in-house use and not marketed externally. The database is continuously updated to include recent innovations [7, 8] and was the basis for the analysis below. An exemplary dataset can be seen in Table 2. The classification of innovations within the database is closely aligned with the Swedish Industrial Classification (SNI). The specific categories are defined in Table 3.
| Year of Commercialization | Product Code | Innovation Category | Labor Market |
|---|---|---|---|
| 1971 | 30010 | Environmental Innovation | Stockholm/Södertäilje |
| 1985 | 28125 | Food and Life science | Nyköping |
| 1977 | 32111 | Generig Engineering | Göteborg |
| 2010 | 11580 | Miscellaneous | Malmö |
| 1994 | 29080 | Forestry | Umeå |
| ⋮ | ⋮ | ⋮ | ⋮ |
Tab.2 Exemplary dataset of product innovations extracted from the SWINNO database. The period of 1970 - 2013 was made available to our analysis.
| Innovation Category | Explanation |
|---|---|
| Environmental Inovations | Innovations developed to solve an environmental or energy problem |
| Food and Life science | Foodstuff, packaging; cooling technology etc. |
| Textiles | Textiles; for use in textiles |
| Wood, Construction, Metals and Mining | Wood, construction materials, innovations for use in mining and construction |
| Paper and Pulp. except Foodstuff Packaging | paper and pulp; except for foodstuff applications |
| Medical Innovations for Medical Applications | E.g. pharmaceuticals, medical equipment |
| ICT, Publishing | Information and Communucation Technology (ICT) and publishing |
| Forestry | Innovations for forestry and agriculture, e.g. deforestation machines |
| Automotive and Land Transportation | Automotive equipment |
| Military Defense | Innovations related to military defense, shipbuilding, aircrafts etc. |
| Environmental + Energy | Innovations developed to solve an environmental or energy problem and innovations otherwise developed for energy production |
| Generig Engineering | Engineering innovations, general use |
| Miscellaneous | Other categories than the ones mentioned above. |
Tab.3 Distinct product innovation categories and their definition that was used in the analysis below. Their definitions were adopted from Refs. [7,8].
First off let’s take a look at the innovation sectors that dominate in each of the 70 labor markets. Figure 5a) displays the leading innovation category, representing the highest number of new innovations in the period from 1970 to 2013, for each region. It can be seen that Wood, Construction, Metals and Mining is leading in many rural regions, while Information and Communication Technology (ICT) – a typical servie sector – is dominating the larger swedish cities like Stockholm, Malmö and Göteborg. In Figure 5b) the share of all categories on the total Swedish innovation count is presented. Due to the prevelence of ICT in the metropolitan areas this category takes up almost a third of all new product innovations in 1970 - 2013. It is followed by the Wood, Construction, Metals, and Mining sectors, with roughly half as many innovations. The other big innovations lie in the energy and environmental sector.
Fig.5 - Regional specialization and national distribution of innovation categories in Sweden:
a) Leading innovation category during the period 1970 – 2013 in each Swedish labor market region, based on the most frequently occurring category of innovations.
b) Overall distribution of innovation categories across Sweden during the same period.
In addition to the dominant innovation category, Figure 6 shows how each region contributes to the overall distribution of Swedish innovation numbers in that time period. Unsurprisingly, the largest labor markets are credible for the most innovations. However, over 20% of all new products originate from more than 50 different labor market regions, each contributing less than 1%. As the German saying goes, “Kleinvieh macht auch Mist”—even small contributions add up.
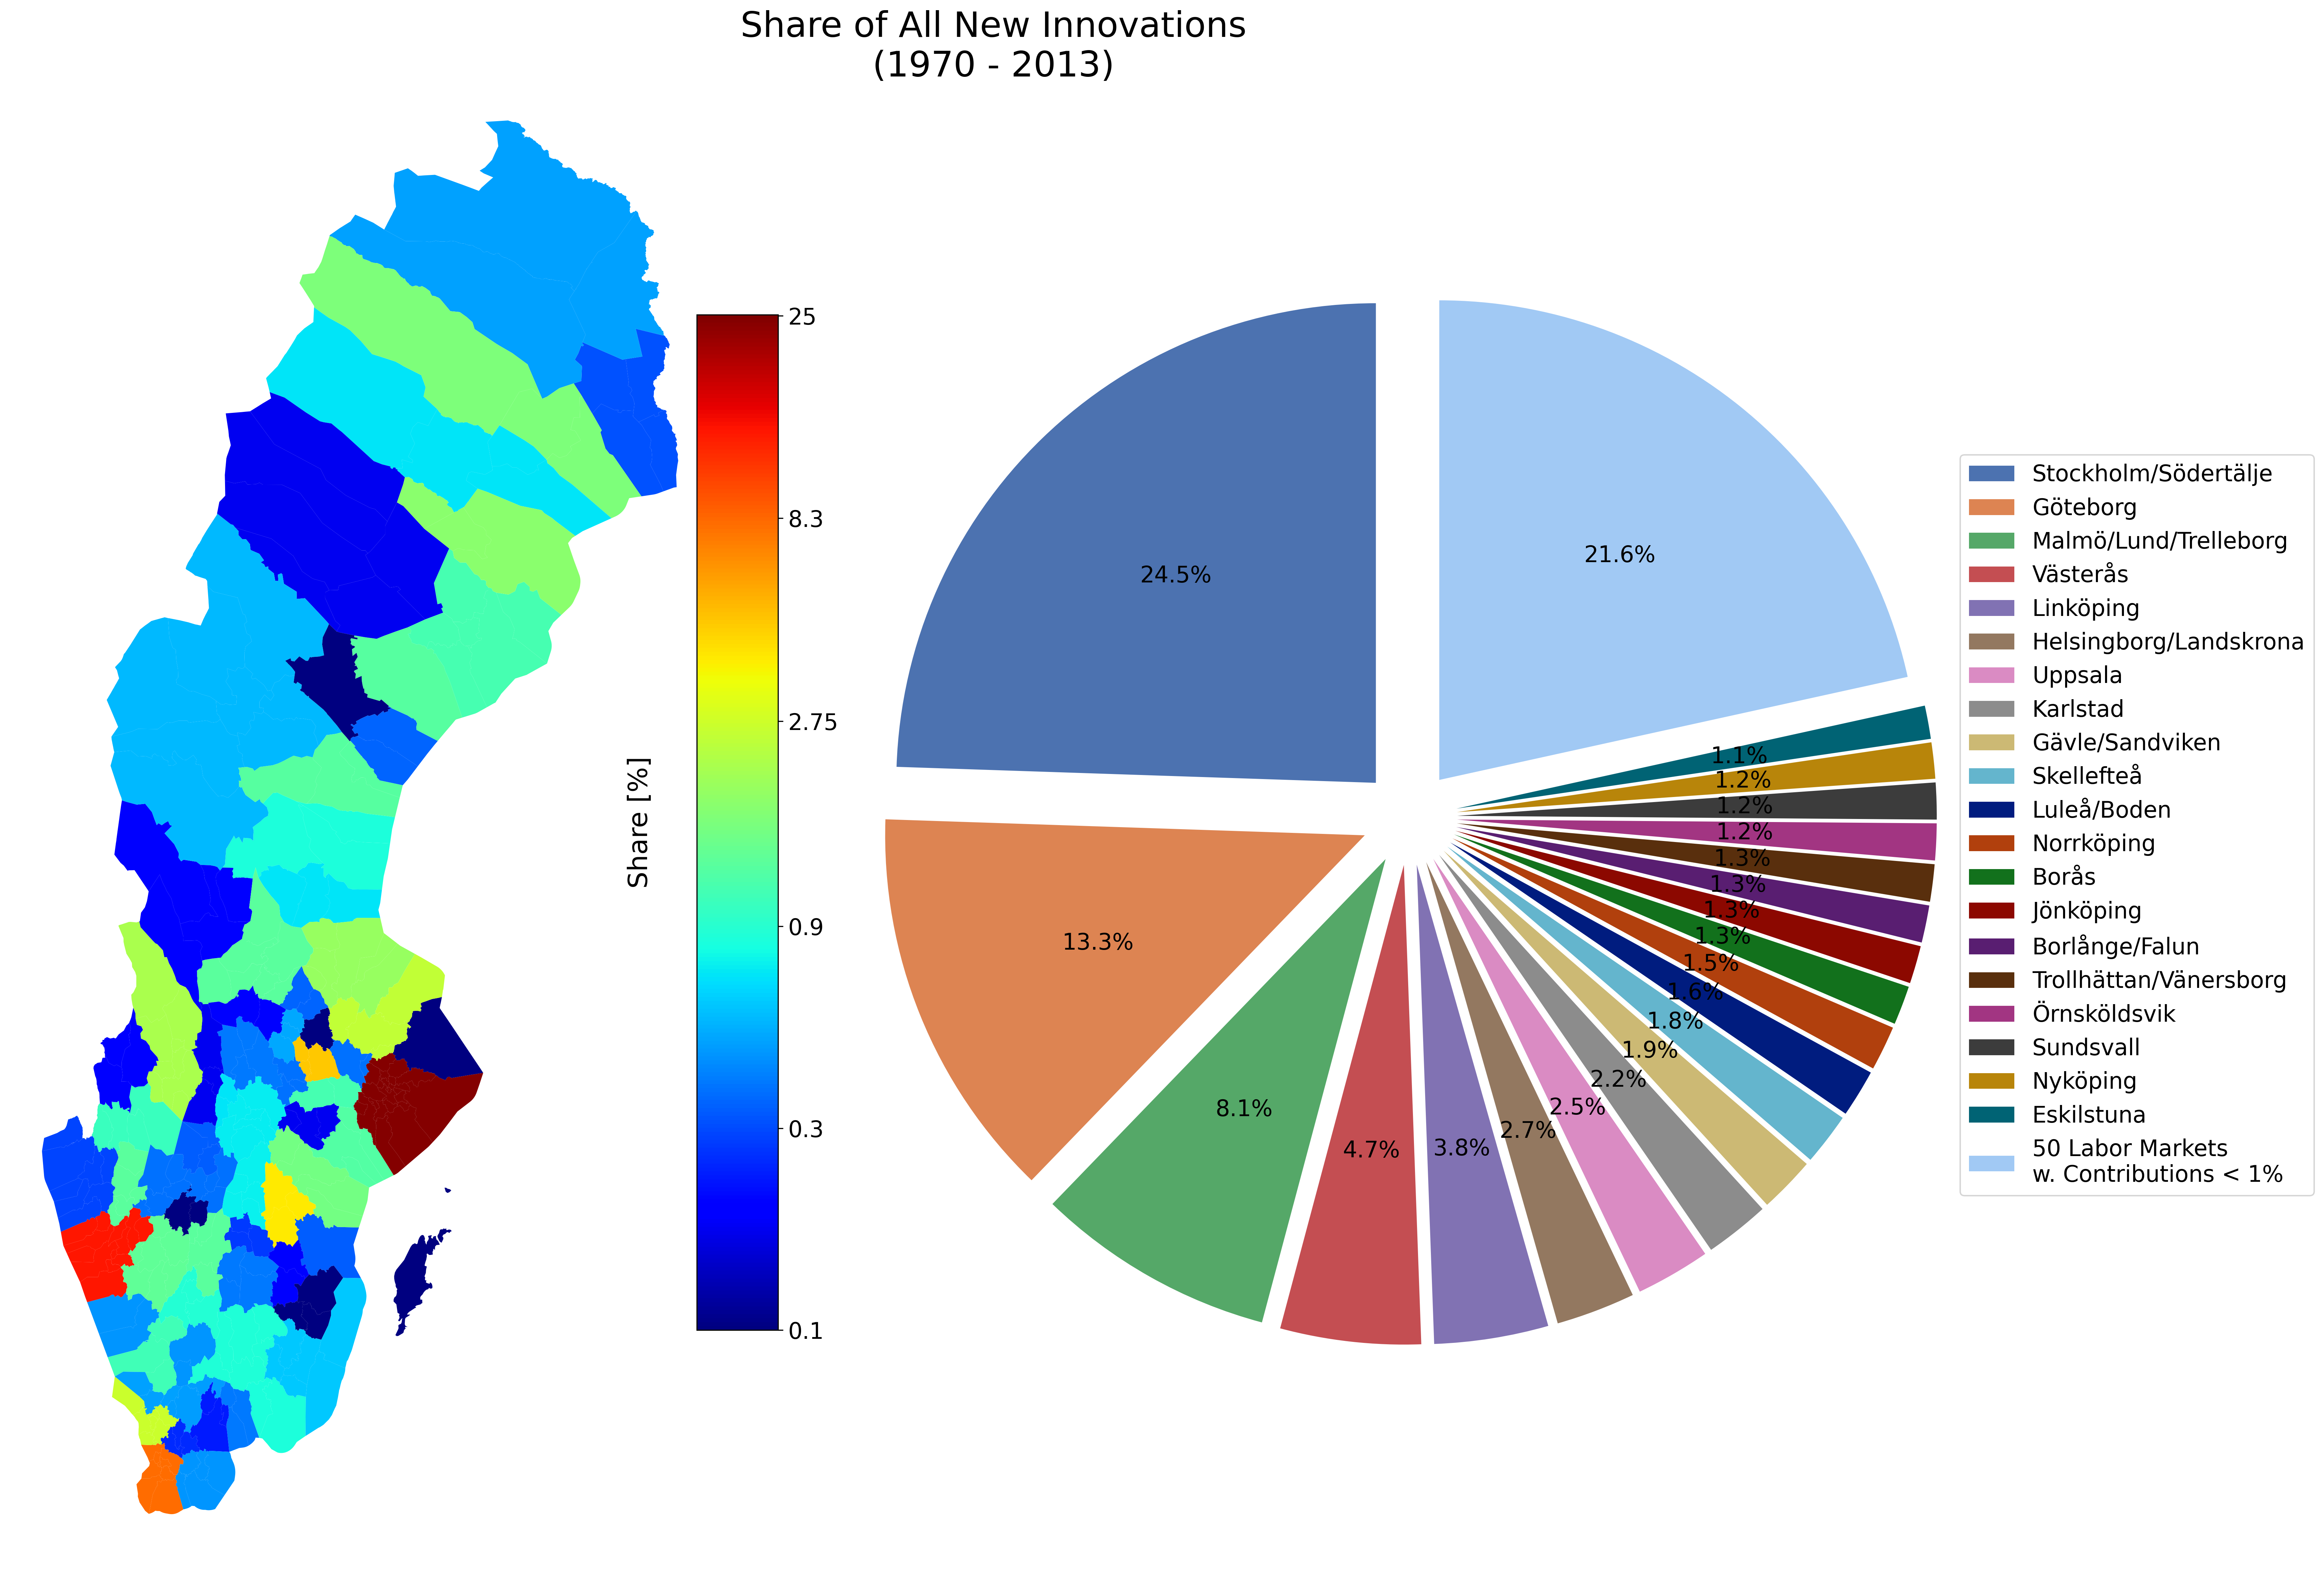
Fig.6- Geographic distribution of innovation output in Sweden (1970–2023):
The map (left) shows the share of all new innovations by labor market region, with color indicating the percentage contribution to the national total (note the logarithmic scale).
The pie chart (right) highlights the same fact, with the top contributors labeled individually and
remaining regions grouped under ‘Labor Markets w. Contributions < 1%’.
We now turn to the question of whether labor market diversity –measured by the birthplace of workers– drives product innovation numbers within a region. To explore this, we compare the temporal trends of both variables and calculate their correlation using the Pearson correlation coefficient \(\rho\). For this we note that innovation output typically should lag behind changes in workforce composition, as the effects of diversity take time to materialize. Therefore, the Hill number for a given year was matched with the total number of innovations produced over the subsequent five years. The results for the period of 1970 - 2013 in figure 7a) which shows the correlation coefficient for each labor market. It can be seen that, while many regions show weak correlations (\(\ |\rho| < 0.25\)), they are pronounced in East Middle Sweden (Östra Mellansverige), Gotland and Piteå. Negative correlations—where, for instance, a decline in workforce diversification is associated with an increase in innovation output – can be observed in parts of Småland (Småland med öarna) and North Middle Sweden (Norra Mellansverige). Two extreme cases Nyköping (\(\rho = 0.82\)) and Växjö \(\rho = -0.77\) are shown in figure 7b). There the temporal evolution of Hill number (blue line) and innovation counts (green bars) are plotted. In the first case, both diversity and innovations have decreased over time, while for the latter diversity increased and innovations dropped.
Figure 7c displays a histogram of the correlation coefficients of all labor markets, revealing a slight skew toward positive values. This indicates that in most regions, labor market diversity seems to be positively associated with innovation output, with the highest frequencies occurring between \(\rho=0.1\) and \(\rho=0.4\). This suggests that our diversity metric often correlates with increased innovation. Finally, it’s important to note that \(\rho\) captures only linear relationships, and the five-year time lag is an assumed parameter. Nevertheless, it is interesting to see what relationships can be extracted from these datasets.
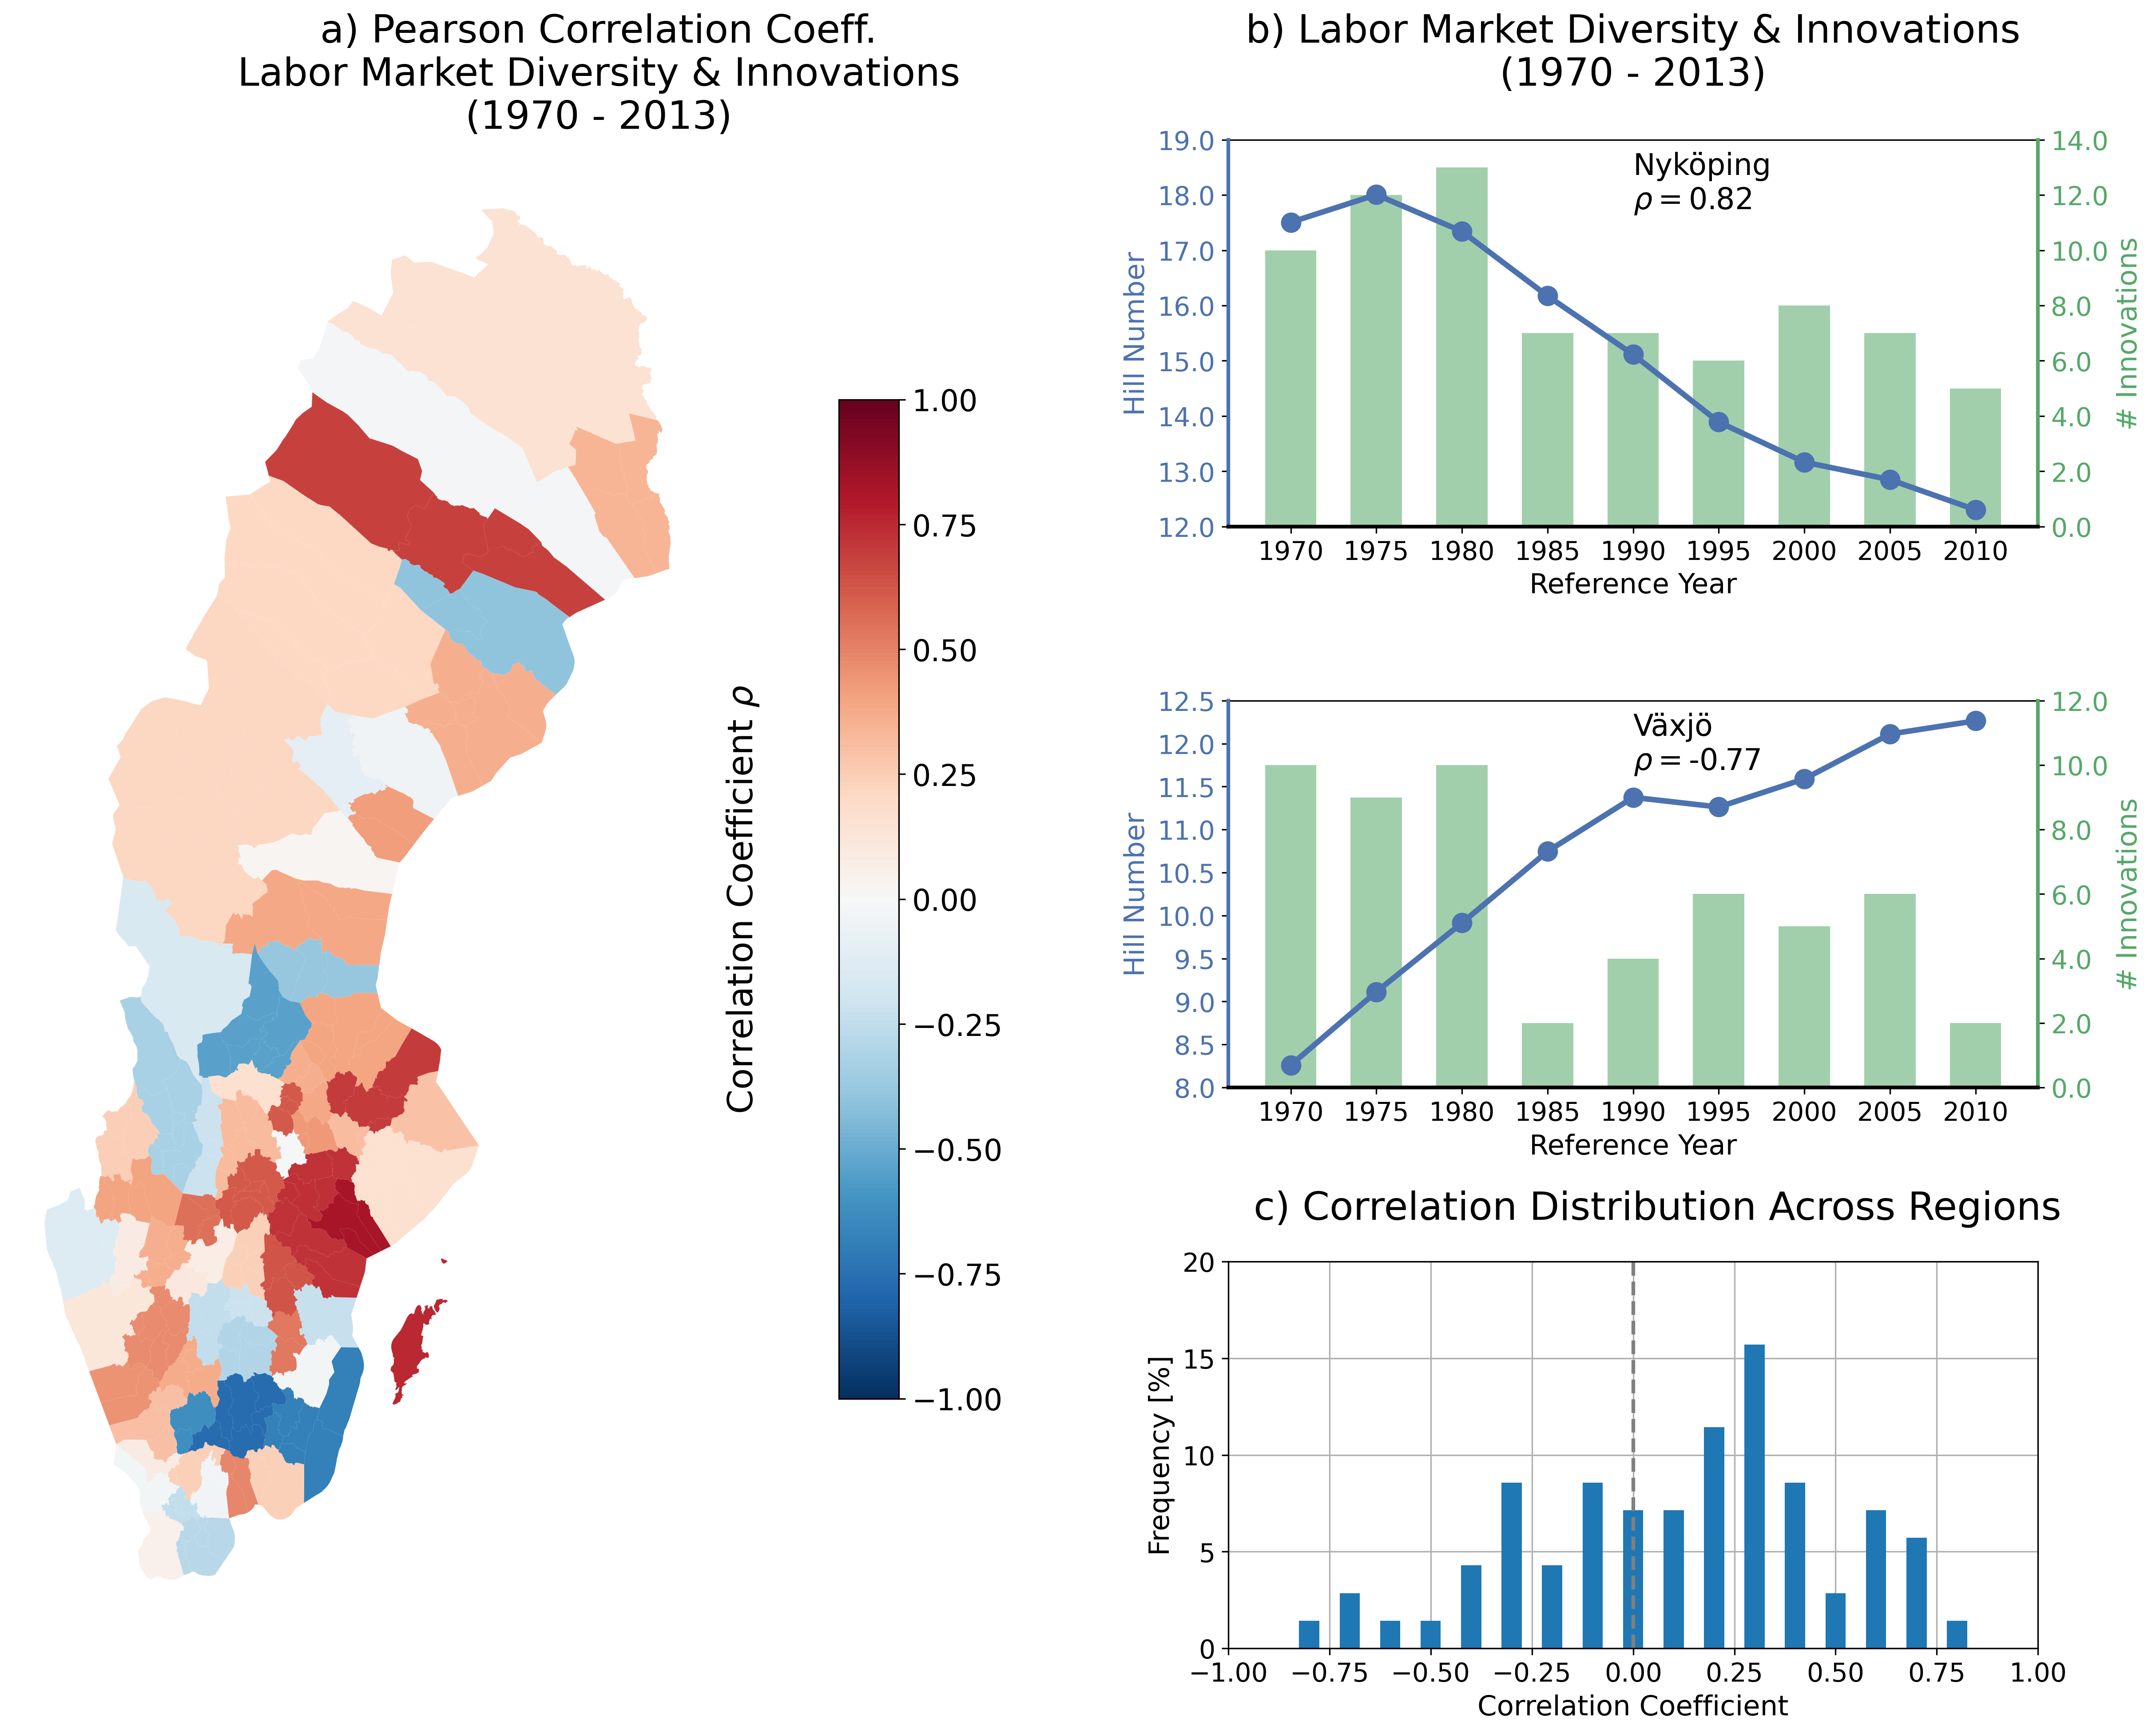
Fig.7- Assessing the Link Between Labor Market Diversity and Innovation:
a) Regional Pearson correlation between labor market diversity and forward five-year innovation output.
b) Trend of the two regions Nyköping and Växjö: Labor market diversity (Hill number) and the number of innovations observed in the subsequent five-year window,
starting from each reference year. The correlation coefficient \(\rho\) is given as well.
c) Histogram of Pearson correlation coefficient over all labor market regions.
Conclusion and Outlook
This post presented a data analysis of two datasets that were examined in terms of an entropy measure for labor market diversity and the number of innovations for these regions. A first connection between the two quantities was drawn. Many regions exhibit a strong positive correlation between the two variables. In contrast, other regions display weak or even negative correlations, indicating exceptions where diversity may not foster innovation, possibly due to local economic structure, specialization, or other confounding factors. The distribution is centered around weak-to-moderate positive correlations, with very few regions showing correlations stronger than \(\rho = \pm 0.75\).
Other characteristics of labor markets are likely also relevant and surely worth exploring. This might be the composition of the industrial sectors of each labor market, which are also present in the first dataset form of the Swedish SNI69 code. However, this requires are deeper look into the classification of the industries that are subsimissed into the nine SNI69 classes. Moreover, breaking down the data by sex could provide valuable insights, potentially revealing gender-based imbalances. The same applies to salary data, which could shed further light on inequalities within the social structure.
Acknowledgement
I would like to thank Ludvig Lizana and Rikard Eriksson for introducing me to this fascinating topic and supporting me throughout the project. My thanks also goes to my former PhD supervisor, Jörg Schumacher, for encouraging me to pursue this work, even though it was outside the scope of my doctoral research. Projects like these, which diverge from your everyday work, challenge you to think in new ways, while applying familiar concepts from one field to another. This is what has ever since fueled my passion for science and research.
References
[1] Statistics Sweden - Population Statistics 2021-2024
[2] Statista - Population of Stockholm from 2010 to 2022
[3] Statistics Sweden - Kommuner i Siffror
[4] Backman and Kohlhase (2021) - Labor force diversity and new firm formation
[5] Budescu and Budescu (2012) - How to measure diversity when you must
[6] Sjöö et al. (2014) - SWINNO: A Database of Swedish Innovations, 1970-2007
[7] Taalbi (2017) - Development blocks in innovation networks
[8] Taalbi and Karlsson (2018) - Regionala innovationsmönster
Appendix
List of the 70 labor markets that were considered in our study
- Stockholm/Södertälje
- Norrtälje
- Enköping
- Uppsala
- Nyköping
- Katrineholm
- Eskilstuna
- Mjölby/Motala
- Linköping
- Norrköping
- Jönköping
- Tranås
- Eksjö/Nässjö/Vetlanda
- Värnamo
- Ljungby
- Växjö
- Västervik
- Hultsfred/Vimmerby
- Oskarshamn
- Kalmar/Nybro
- Visby
- Karlskrona
- Karlshamn
- Kristianstad
- Hässleholm
- Ängelholm
- Helsingborg/Landskrona
- Malmö/Lund/Trelleborg
- Ystad/Simrishamn
- Eslöv
- Halmstad
- Falkenberg/Varberg
- Göteborg
- Uddevalla
- Trollhättan/Vänersborg
- Borås
- Lidköping/Skara
- Falköping
- Skövde
- Mariestad
- Kristinehamn
- Karlstad
- Säffle/Amal
- Arvika
- Örebro
- Karlskoga
- Lindesberg
- Västerås
- Köping
- Fagersta
- Sala
- Borlänge/Falun
- Avesta/Hedemora
- Ludvika
- Mora
- Gävle/Sandviken
- Bollnäs/Söderhamn
- Hudiksvall/Ljusdal
- Sundsvall
- Härnösand/Kramfors
- Sollefteå
- Örnsköldsvik
- Östersund
- Umeå
- Skellefteå
- Lycksele
- Piteå
- Luleå/Boden
- Haparanda/Kalix
- Kiruna/Gällivare
List of the additional 7 birth regions for foregin born workers
- Non-Swedish Scandinavian
- Eastern European
- Central, South and Other European
- Former USSR states
- South & North America, Australia, New Zealand & Japan
- Africa
- Asia, Turkey & Oceania